Maerten, L., Soliva, R., Maerten, F. , Aaltonen, I., Wilkström, L. and Mattila, J., 2009, Fault Reactivation and Fault Properties - 3D Geomechanical Modeling Approach and Application to Nuclear Waste Disposal. 2nd International Conference on Fault and Top Seals – From Pore to Basin Scale Montpellier, France, 21-24.
Soliva, R., Maerten, F., Maerten, L. and Mattila, J., 2019, Fault slip envelope: a new parametric investigation tool for fault slip based on geomechanics and 3-D fault geometry. Solid Earth, 10 (4), 1141-1154.
Context
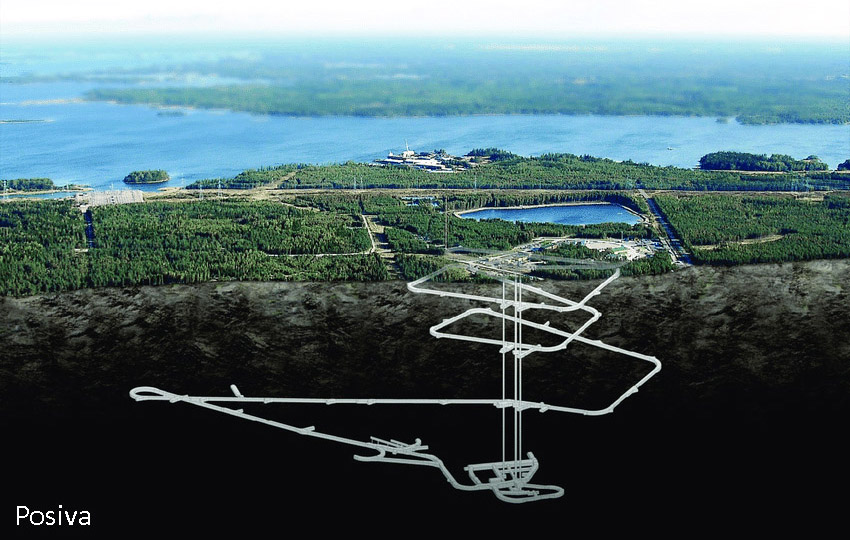
Client: Posiva Oy
Location: Olkiluoto Island, Finland
Main goal: Model fault reactivation over time in a buried nuclear waste disposal area
Geology: Fractured gneisses
Tectonic: Glacial cycle
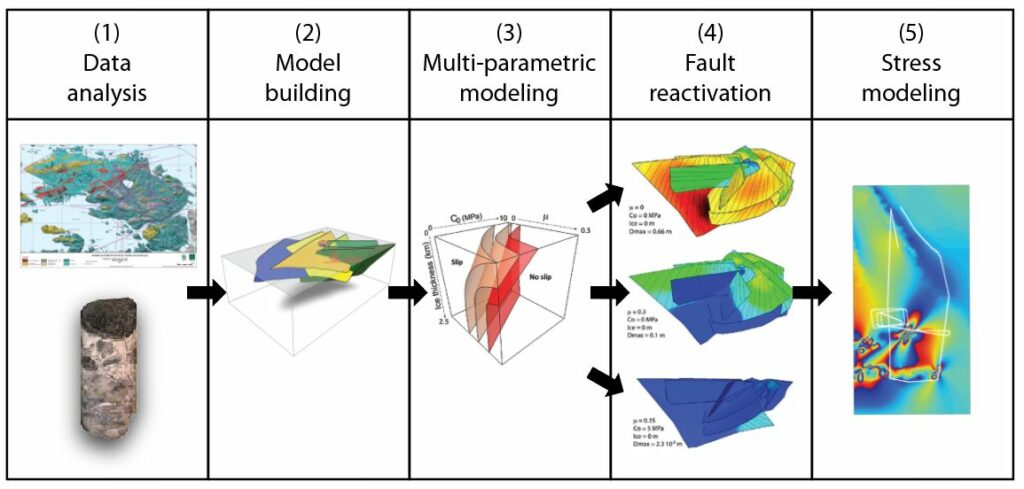
Methodology
Data analysis and interpretation
3D model building
Multi-parametric models (ARCH)
Fault reactivation risk over time (ARCH)
3D stress models over time (ARCH)
Other applications using similar methodology
This workflow for modeling fault reactivation can also be applied to:
Geothermal energy
CO2/gas storage
Oil and gas production
Mining
Earthquake study
Main outcomes
3D geometry of the fault system at the nuclear waste site
Interpreted major fault surfaces that have been triangulated for the geomechanical simulations.
Tunnel location (red) to access the nuclear waste repository area.
Modeled far field stress conditions
Stress state in the rock mass applied to the fault system (Arch), measured at the present day (0 m of ice) and calculated for future conditions as a function of the thickness of ice sheet cover (for 1500 and 2500 m of ice). The maximum horizontal stress (sH) is oriented E–W.
Multi-parametric simulation range and results
Fault slip envelope of the Olkiluoto fault system (red surface) calculated from about 15000 geomechanical simulations (Arch) using variable friction, cohesion, and stress profiles derived from 0 to 2500 m of ice sheet cover.
The two light surfaces are envelopes of values of equal maximum quasi-static displacement computed along faults (Arch), each one corresponding to a specific value of displacement (0.02 and 0.06 m).
Measured ranges of rock cohesion and internal friction fall within the safe (no slip) model parameters.
Computed fault slip distributions
Examples of 3D quasi-static fault slip distribution (Arch) on the Olkiluoto model for different loading and fault property conditions indicated on the fault slip diagram by blue stars.
Streamlines on fault surfaces are modeled slickenlines. The color bar scale for displacement
is logarithmic.
Modeled stress distribution
Modeled of stress distribution caused by fault patch reactivation (earthquake) during deglaciation or glaciation.
This scenario is highly unlikely to happen as measured ranges of rock cohesion and internal friction fall within the safe (no slip) model parameters.